Blockset described on this wiki is deprecated since 2012.
For Model Based Design (MBD), use the free MPLAB Device Blocks for Simulink, tool from Microchip.
Updated Rapid Control Prototyping (RCP) custom projects are published at: https://lubin.kerhuel.eu.
File:IMU simu RealData Curves.png
IMU_simu_RealData_Curves.png (649 × 463 pixels, file size: 25 KB, MIME type: image/png)
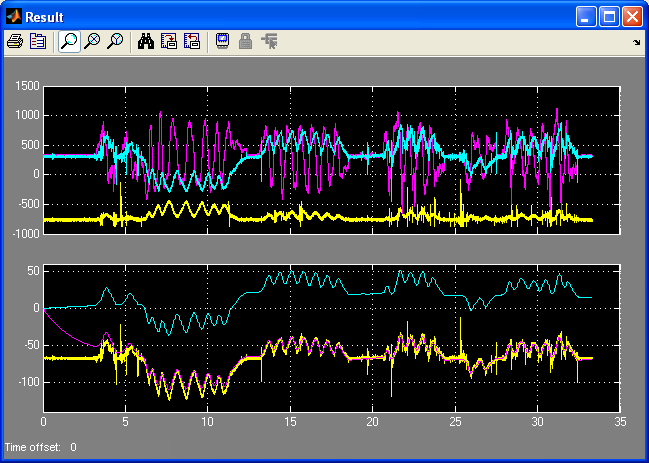
Top curves : The X (yellow) and Z (cyan) accelerometers raw data with the Y axis rate gyro (pink). The y scale is the raw numerical value as read from the Gyro-SPI bus. The x scale is time (simulation duration is 33,32s). The three bottom curves are the simulated estimation of the angle (Y axis) using three different methods. The yellow curve is the estimated angle from the X and Z accelerometers, sensing the gravity. The cyan curve is the estimated angle, integrated from the Y rate gyro. The pink curve is the estimated angle estimated with the complementary filter that fusion the relevant informations from both the Y rate gyro and the X-Z accelerometer
File history
Click on a date/time to view the file as it appeared at that time.
| Date/Time | Thumbnail | Dimensions | User | Comment | |
|---|---|---|---|---|---|
| current | 21:32, 13 June 2008 | | 649 × 463 (25 KB) | LubinKerhuel (talk | contribs) | Top curves : The X (yellow) and Z (cyan) accelerometers raw data with the Y axis rate gyro (pink). The y scale is the raw numerical value as read from the Gyro-SPI bus. The x scale is time (simulation duration is 33,32s). The three bottom curves are the s |
- You cannot overwrite this file.
File usage
There are no pages that use this file.