|
 |
home » Embedded Target for dsPIC » Examples » Explorer 16 Development Board |   |
|
|
Explorer 16 Development Board |
|||||||||||||||||||||||||||||||||||||||||||
|
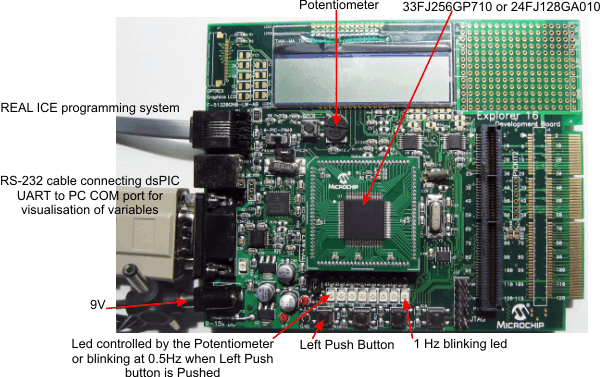
Acknowledgement: Thanks to Microchip® for Providing the Explorer 16 Development Board with the REAL ICE programming system. This example use the Explorer 16 Development Board with the dsPIC 33FJ256GP710 or the PIC 24JF128GA010 microcontroller. With the dsPIC blockset, we get from the simulink model:
Configure Simulink
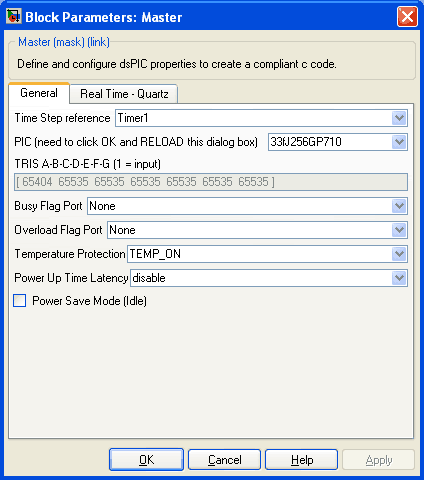
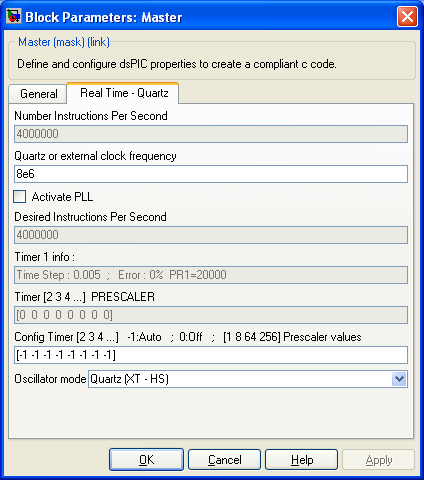
Set the dsPIC configurationOpen the Master block.
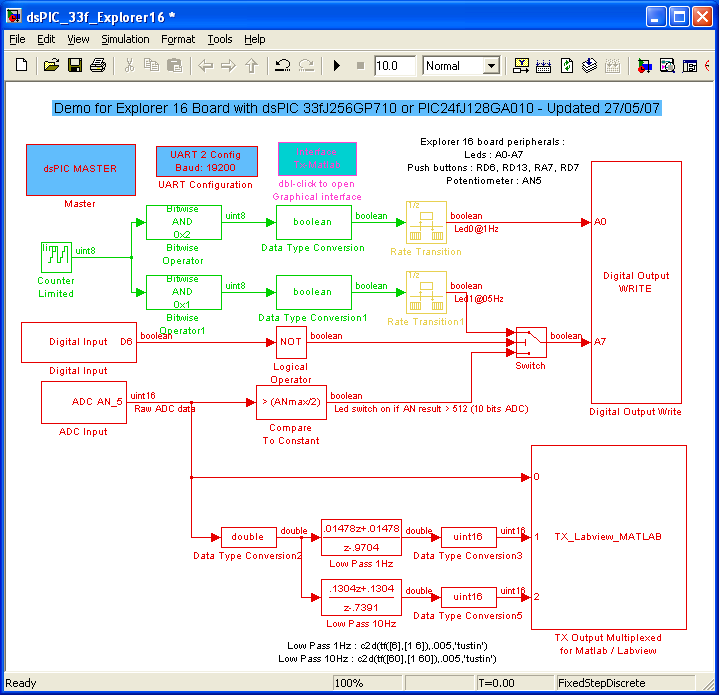
Blinking LedA counter is used to make blinkind leds. Its sample time set to 1 for 1 seconde makes it count at 1Hz. The model has blocks with a sample time of 5ms (model main sample time) and others with 1 seconde (which is a multiple (X200) of the model sample time). Thus, this is a multirate model.
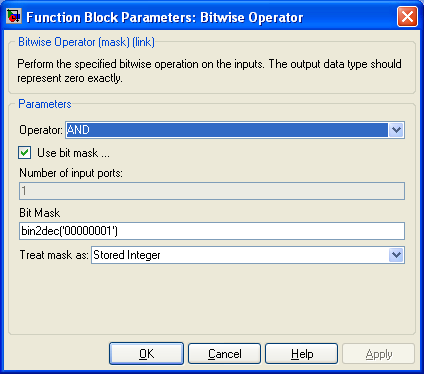
The counter is configured to count from 0 to 3. Bitewise logic and extract bit 0 and bit 1 of the counter. These bits are sent to the Digital Output Write bock.
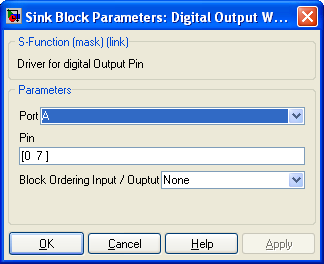
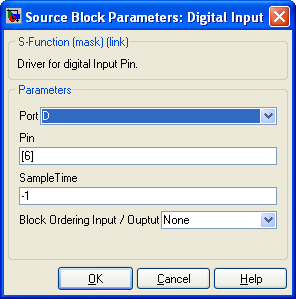
The Digital Output Write block switch on or off Leds connected to the PIN A0 or A7 of the dsPIC depending on the block's input values. The refresh rate of this block is 200Hz (5ms : Red). Note : We could use two separate blocks : one for the port (A0 ) with a refreshing rate of 1Hz and another one for the third led (connected to A7) with a refreshing rate of 200Hz. Digital InputThe Digital Input block's output value is 0 while the button is pushed. The diagram make the LED blink when the button is pushed.
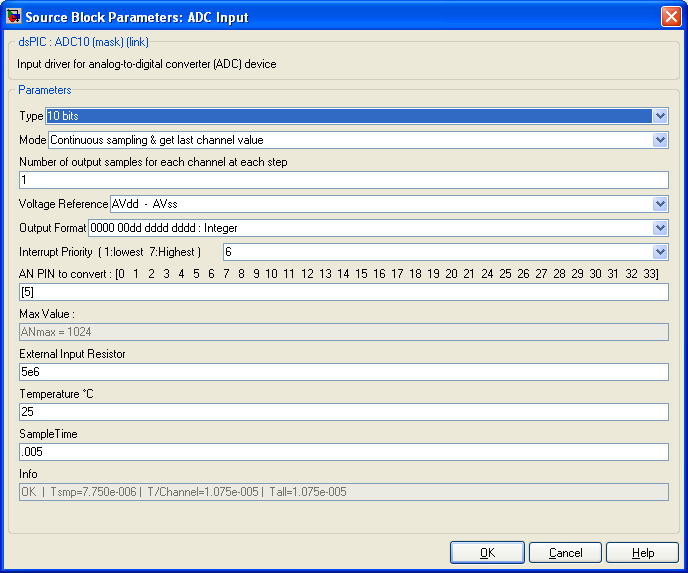
Sampling and Filtering data from ADCPotentiometer is connected to the AN5 PIN. We used here the 10 bit ADC converter of the dsPIC but we using the 12 bits ADC is possible and switching from one to the other is as simple as selecting which one you want to use (one click solution !).
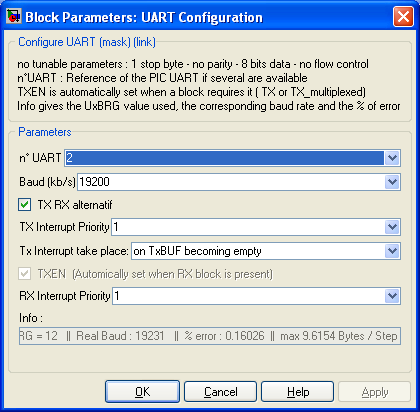
The value converted is an unsigned 16 bit variable where only the 10 lower bites are used. The output value of the ADC block is compared to ANmax/2 that is the mid position of the potentiometer (corresponding to a tension of 1.65V). When the value converted is greater than ANmax/2, the led connected to the port A7 switched on otherwise it is switched off. The output value of the ADC block is also filtered with two different filters. The matlab filter block used works using double data type. It needs double data types at its input and provides double data types at its output. Two conversion blocks are used. Note however that calculation using double are time consumming for the dsPIC and it is preferable to realize fixed point filter. The fixed point toolbox is very helpfull to make precise and efficient calculation using only fixed point variables. Logging & Plotting data in Matlab (dsPIC side)Data transmition is done using the UART dsPIC peripheral and one PC serial COM port. The demo board RS-232 serial port must be connected to one COM port of the PC. First of all, the baud rate of the UART must be set. For each baud selected, the Info text box show the real baud obtained the the % error from the selected baud. The % error must be low (absolute value of error belo 3%) for the RS-232 serial transmition to work properly. Using a 8Mhz quartz with no PLL (obtaining 4 MIPS) the fastest workable baud rate is 19200. The UART port of the board with the appropriate max3232 component is connected to the UART 2 of the dsPIC.
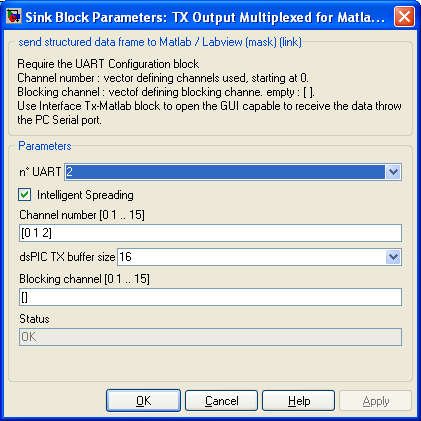
Once the UART is configured, the block to send data from the dsPIC to Matlab is configured. We set 3 channel to send 3 different data. Once the model is generated, compiled and the .hex file is loaded into the dsPIC, data will be logged and view with the matlab User Interface created. This one can be opened either in double clicking onto the block 'Interface Tx-Matlab' or typing at the matlab prompt >> rs232gui Generate C code, Download the hex file into the dsPICOnce the model is finished, C code is generated and compiled : click on the 'Incremental build' button or press 'Ctrl+b'. The .hex file obtained in the same directory of the. mdl file can be loaded into the dsPIC using MPLAB : go to MPLAB, File==> Import and select the .hex file, then, download it into your dsPIC using either ICD2, Real ICE or others... html report with the C code generated can be generated. Go to Simulation ==> Configuration Parameters ==> select Real Time Workshop on the left column and check the option Generate HTML report on the right pannel. The model was compiled with Matlab 2007.
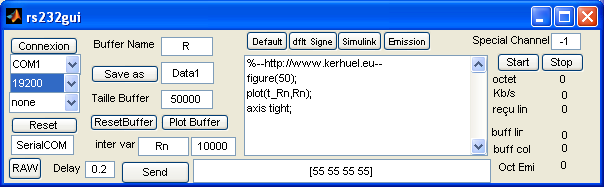
Logging & Plotting data in Matlab (PC side)The .hex file is loaded into the dsPIC, you get two led blinking at 1Hz and 0.5Hz and the Explorer 16 Demo board is connected to one PC COM port. Open the rs232gui user interface ( click twice on the block 'Interface Tx-Matlab' or type rs232gui at the matlab prompt.
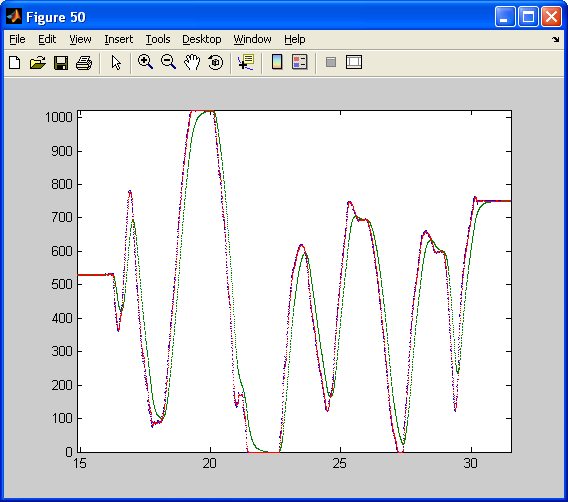
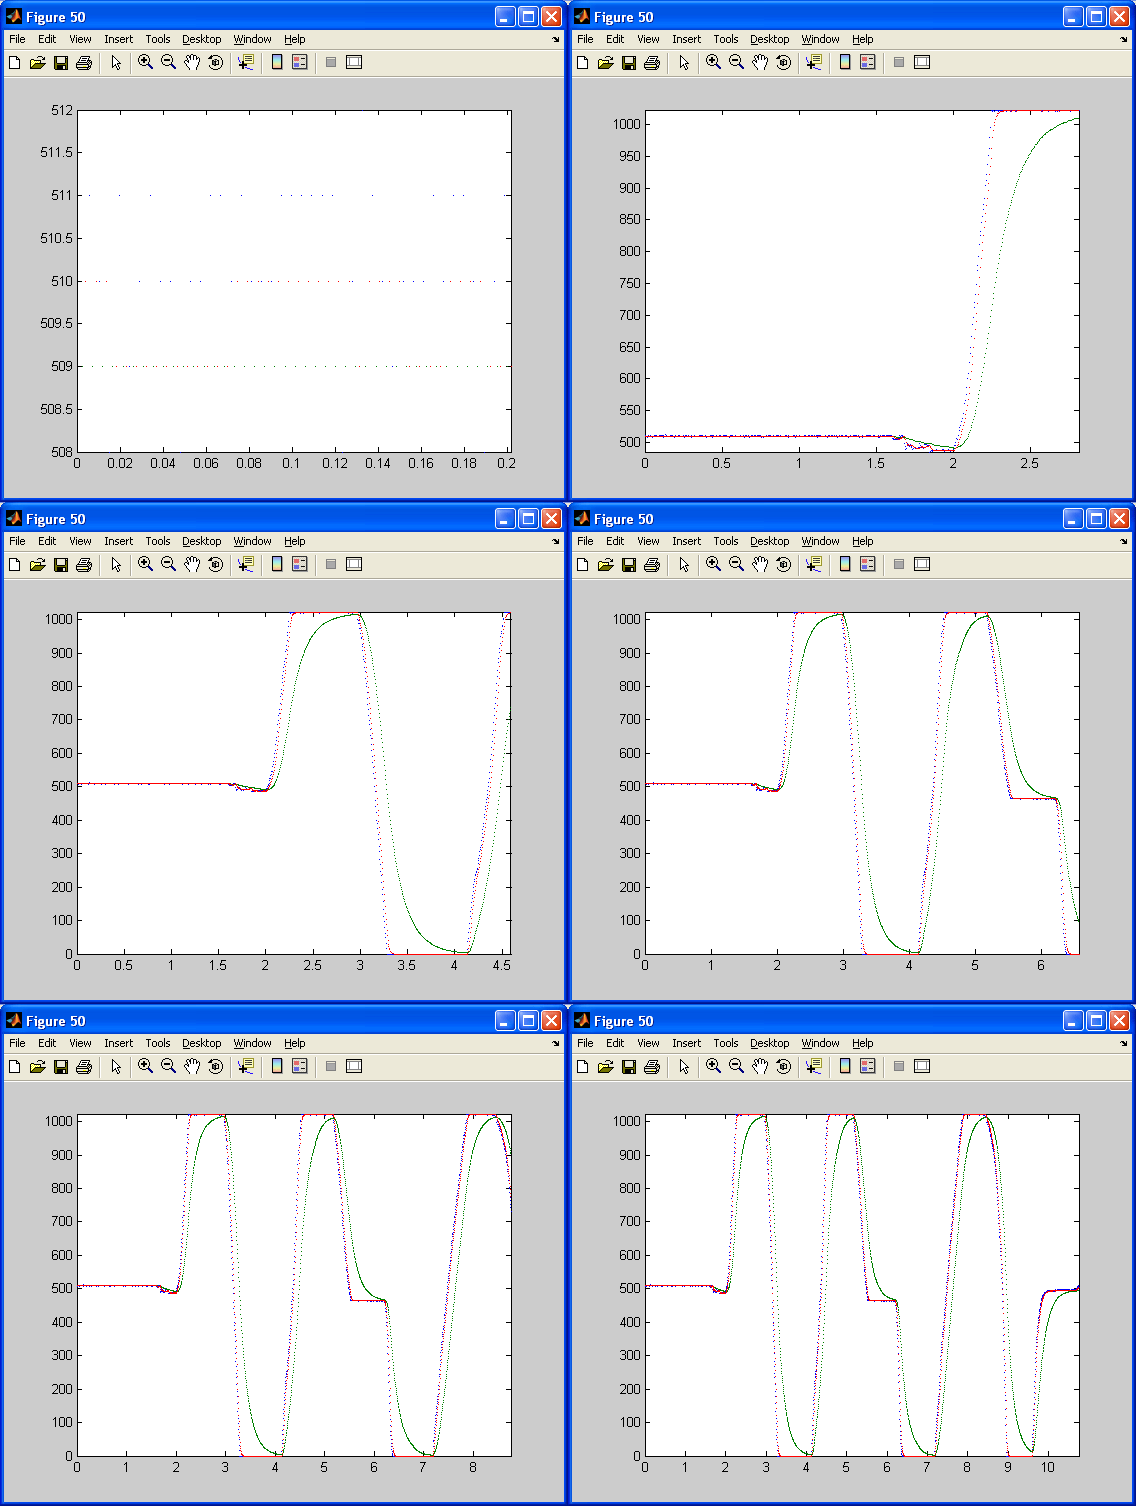
Set the COM port to the one you are using (PC side) and set the baud rate to 19200 (same as dsPIC). No flow control used. Then,click on Connexion, wait 3 seconds and click on the Start button. On some PC, Matlab closed if you click on Connexion while data are being sent from the dsPIC to the PC. In that case, disconnect the dsPIC before pushing the Connexion button. Moving the Potentiometer, you will obtain the following graphic with three curves : the blue curve is the raw data (unfiltred), the red curve is the data filtred at 1Hz and the green curve is the data filtered at 10Hz.
Next...You can now modify the model and compile it with the free demonstration version available. Note however that you could not add PINs to the model due to the 6 I/O PINs limitation of the downloadable version. You could however remove used PIN to replace them by others. For any question or unclear point, feel free to ask technical question on the forum.
|
||||||||||||||||||||||||||||||||||||||||||||